It’s been a while since we came back from our 11185 km trip through Europe.
So I’d like to look back at our numbers. I’m only looking at the period from the start in Brussels to the finish in Barcelona, where we were in “race mode”, so to speak, and focused on maximum solar production. The most important figures are :
Brussels – Barcelona: 8’072km
79,194 Wh of solar energy
80’703 Wh Consumption
9.74 Wh/km Consumption
27.14 km/h Average speed in the saddle per day
in the saddle per day: 6h21min
1754 Wh average solar yield = 365Wh/100Wp solar cells and day
3102Wh solar record=646Wh/100Wp
172 km/day (without rest day in Konstanta)
If one were to take the whole trip (Brussels-Lyon, return), the daily mileage would drop to 160, but the average speed would increase to 27.6km/h. The solar yield over these 9084km is about 96kwh.
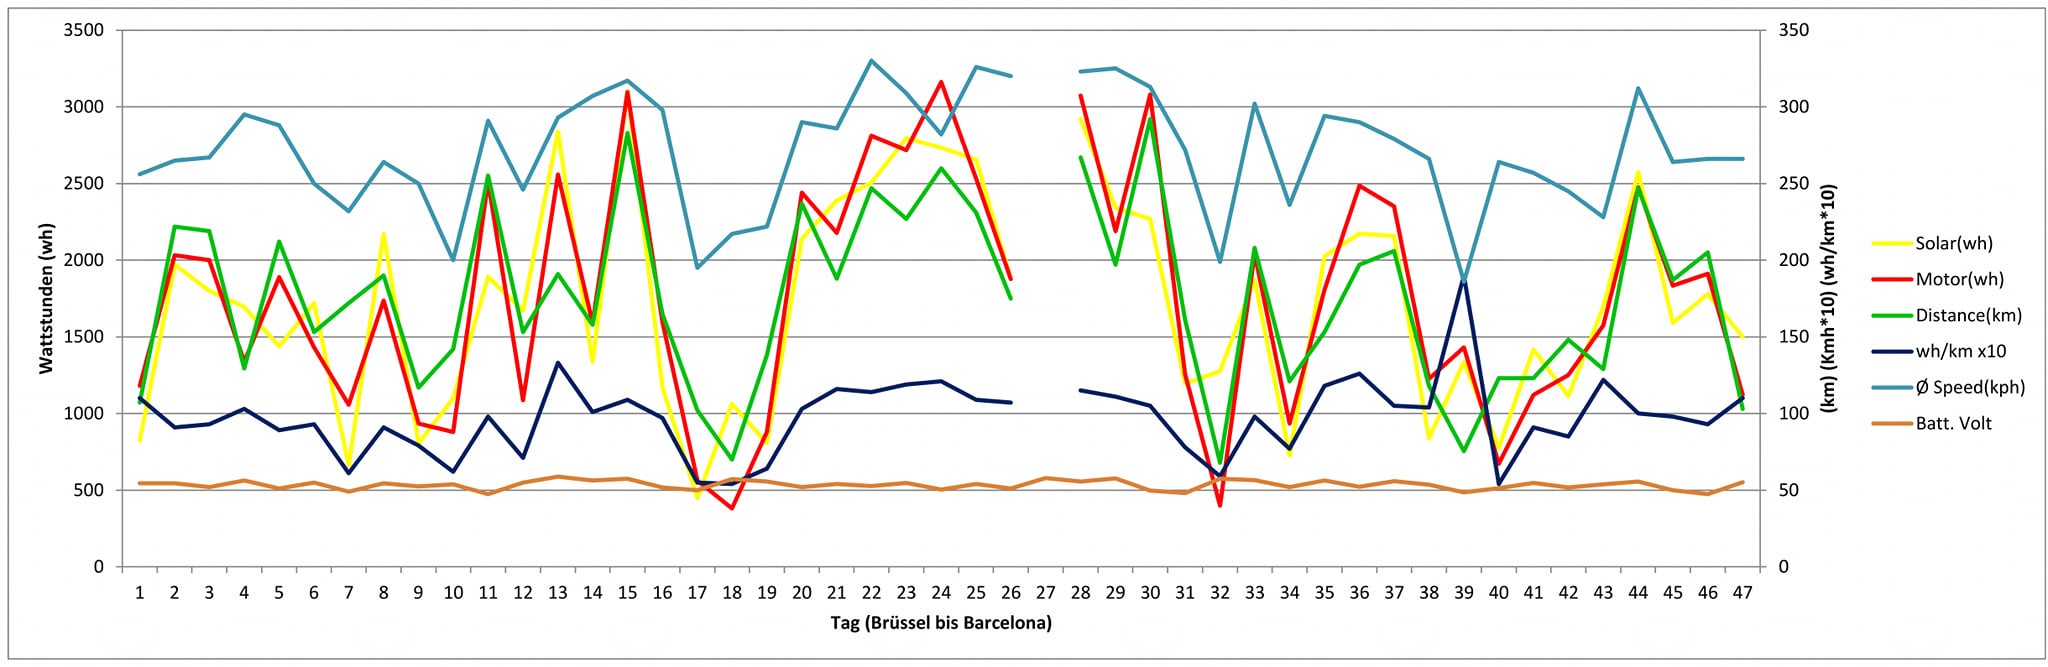
Our route in a diagram (tip: open the Excel file below)
In the graph you can read:
Production (yellow) and consumption (red): It is very clear that production and consumption have to follow each other closely, because the battery is for me only a small buffer with a capacity of only 1 kWh with a production up to 3 kWh / day. It is therefore clear that the battery capacity has to be well distributed over the day, or you have to drive in such a way that the battery does not fall out during a break. This happened to us several times at midday.
All the curves follow the solar production closely: The same applies to the distance travelled. On days with few kilometres, the battery comes into play: for example, on the 7th day we drove 170 km and drew 400 Wh from the battery. Consumption is low with 6.1wh/km and an average of 23.6kmh.
However, the solar energy falls off in the middle of the day, i.e. the battery is mainly used to provide energy for driving in the evening and morning, so it is ideal that the battery is not below half (52V) in the morning when leaving If this is the case, the sun should come out soon. In bad weather : (solar output 400-1000wh) you can still easily do 100km if you want, but the driving pleasure is different.
In summary: ½ of the battery is a daily buffer and ½ is a reserve for bad weather.
When the weather is good, a discharged battery is irrelevant during the day, or even desirable for a longer break.
Battery voltage at the end of the day
A full battery doesn’t matter, it means you could have ridden longer that day, but an empty battery is uncomfortable the next morning when the clouds cover the sun. (Poker game with the weather)
For the calculators: these figures were created with a solar-optimised driving style: if the sun is not at the centre of the journey, the average of 365 Wh of solar energy per 100 peak watts per day will not be correct. Solar optimisation means: never let the battery fill up completely. Align the panels while driving and resting. And never park in the shade!