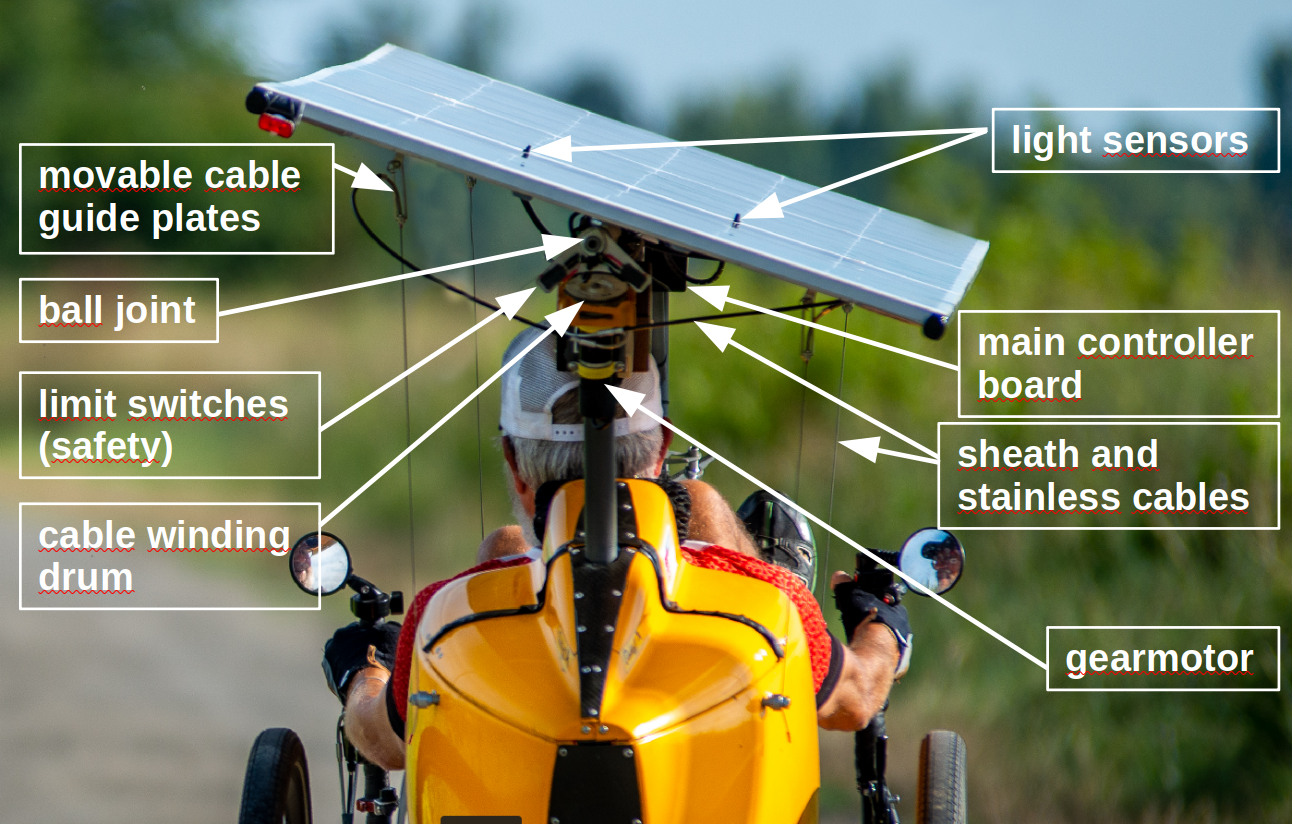
The functional blocks of a 1 axis solar tracking system by EcoSunRiders !
However, the true efficiency of this tracking devices (manual or automatic), the advantage is strongly dependent on the season:
- in summer, especially in June and July, dhe additional energy production afforded by the tracker is not really significant (5 to 10% maximum) due to the complexity of the device, but in winter the production is multiplied by more than 2.
- in winter (very low sun trajectory), i also run some measures riding with the “TwinDragonfly” and “TiltDragonFly around Pyrénées. The solar production was more than double when I used my solar tracking system.
Here is the analysis of the solar productions on the Suntrip 2018 first stage (19/06/2018).
Raw extracted data from all databoxes does not allow to draw significant trends.
NB: This is based on the data collection of 12 teams, all other team’s data were not reliable enough to include them (recording problems, incomplete set of dates, etc.).
I decided to run the analysis on the first stage because:
- All participants started at the same time, on the same road, from the very same place
- Batteries were fully charged
- All teams had the same solar exposure
The only divergent parameter is the itinerary choice from Martigny, Switzerland.
That is the reason why I added the riding direction in the table: percentage of ride time in both directions (North to South and East to West).

Purpose of this analysis:
- Compare real solar energy production to solar panel rated power
- Only during riding time on the range 10 am – 6 pm
- On the entire day (stops included) on the range 10 am – 9 pm
- Measure the benefits of solar tracking systems (manual or automatic)
- Compare efficiency gaps depending on the bike configuration:
- Straight bike with solar panel trailer (solar panel on the back only)
- Straight bike with front and back solar panels
- Recumbent bike (solar panel roof and solar panel trailer)
- Tandems (solar panel roof)
- Solar panel cell types
Ratio: average riding production vs. solar panels rated power
For all participants, this ratio is greater than the one for the entire day (stops included). This is normal because when the motor is in use, the battery current limiter when the battery is almost full does not have any effect (I assumed that the motor energy consumption is at least equal to the solar energy production).
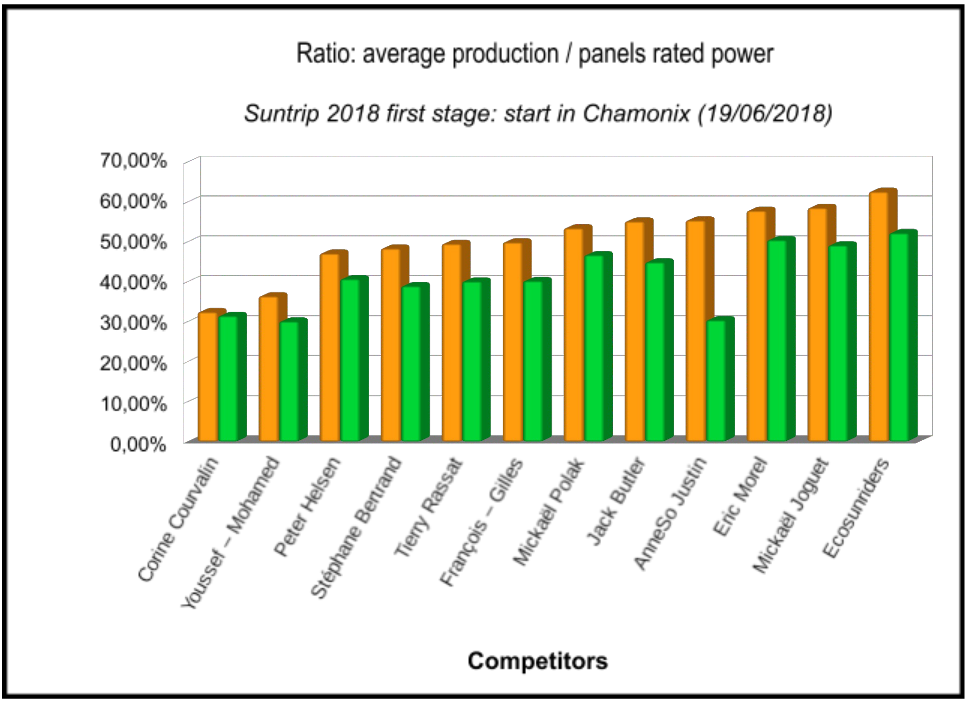
This ratio goes from 47 % (Peter Helsen – cargo straight bike, front and back panels, no tracking) et 62.5 % (EcoSunRiders – recumbent tandem – solar roof – SunPower solar cells automatic tracking).
About Corinne Courvalin and Youssef & Mohamed’s data, their ratio are the lowest, around 33 %. They rode too short distance that day. Their total energy consumption was lower than their bike’s production capacity. The battery charge current limiter when the batteries are almost full penalised a lot their energy production.
Panels position on the bike:
The energy production on bikes with panels only on trailers is always lower because of the riders shadow their panels. Choosing high quality panels, with small cell groups equipped with bypass diodes, as well as extending the trailer drawbar length could reduce this loss in efficiency.
The best choice in terms of production efficiency is the solar roof, which avoids all these disadvantages.
Ratio: daily production vs. panel rated power
Most of the participants, we confirm data we already knew: a ratio between 4.30 (Stéphane Bertrand – recumbent bike – solar roof – solar trailer) and 5.75 (EcoSunRiders – recumbent tandem – solar roof – SunPower solar cells – automatic tracking) times the panels rated power.
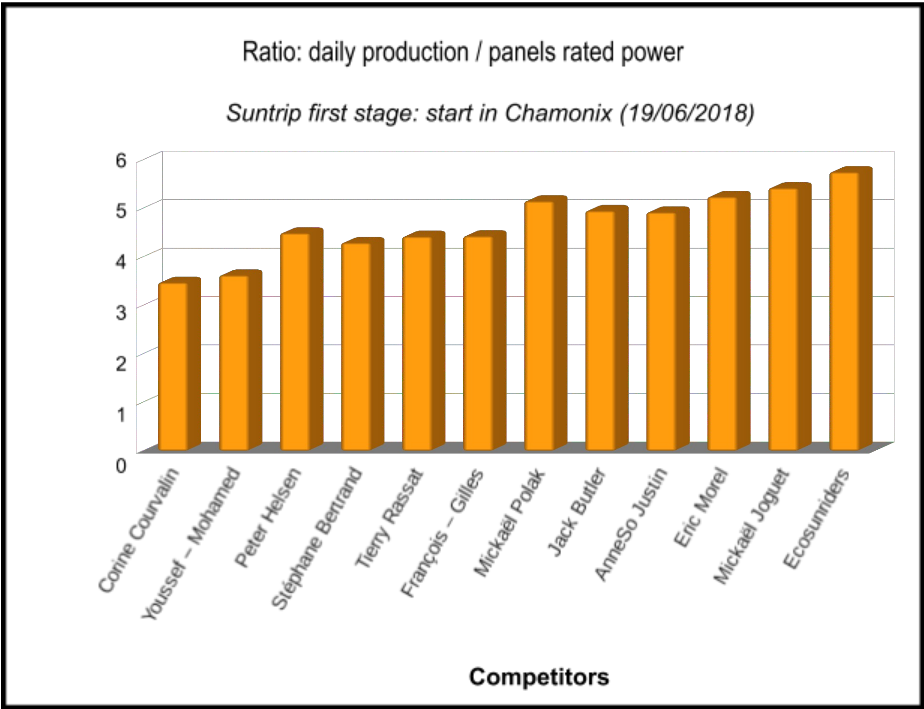
About Corinne Courvalin and Youssef & Mohamed’s data, their ratio are the lowest, around 33 %. They rode too short distance that day. Their total energy consumption was lower than their bike’s production capacity. The battery charge current limiter when the batteries are almost full penalised a lot their energy production.
Solar cell technology:
Stéphane Bertrand was the only competitor riding with PhotoWatt cells (recumbent bike – solar roof – solar trailer). If we compare his ratio with the one of his competitors without tracking (François & Gilles, Peter, Jack, Thierry, Mickaël P) riding with SunPower cells, we note that SunPower ratio is greater than PhotoWatt (4.70 vs 4.30).
This 9 % gain is compliant with the cell constructors’ datasheets.
This result is meant to be considered carefully and cannot be interpreted as a standard, with only one bike equipped with PhotoWatt cells on this Suntrip, the analysis does not have enough data to be relevant. Running this kind of analysis on every stage of the adventure could lead to more reliable results.
Solar tracking system impact:
4 teams (Eric Morel – Douze Cycle, Mickaël Joguet, Anne Sophie et Justin – GrinTechnologies, Yann & Bernard Cauquil – SunPower) were riding bikes equipped with a steering system for their solar panels (manual or automatic). I compared their solar productions with the ones of Stéphane Bertrand, François & Gilles, Peter, Jack, Thierry, and Mickaël P. (Corinne and Youssef & Mohamed data were not relevant for this analysis)

The result is an average of 14 % solar production increase when riding. On the entire day (taking stops into account), the average benefit of these tracking systems drops to 9 % increase.
This impact, which is way lower than I expected, can be explained by several factors:
- in June, the sun trajectory is at the zenith
- the participants’ route direction was mostly East to West, which is not ideal to maximise the tracking system efficiency.
Another analysis based on route portions with North to South direction would allow to determine if the efficiency is more significant.
To travel during the summer season by solar bike, it is useless to make a more complex configuration with solar tracking (manual or automatic). Adding 10 % more surface to the solar panels will get better results.
I also run some measures riding in February (very low sun trajectory) with the “TwinDragonfly” on a loop around Pau. The solar production was more than double when I used the solar tracking system.